Momentum
RSI — Relative Strength Index
n = 14Wilder smoothing
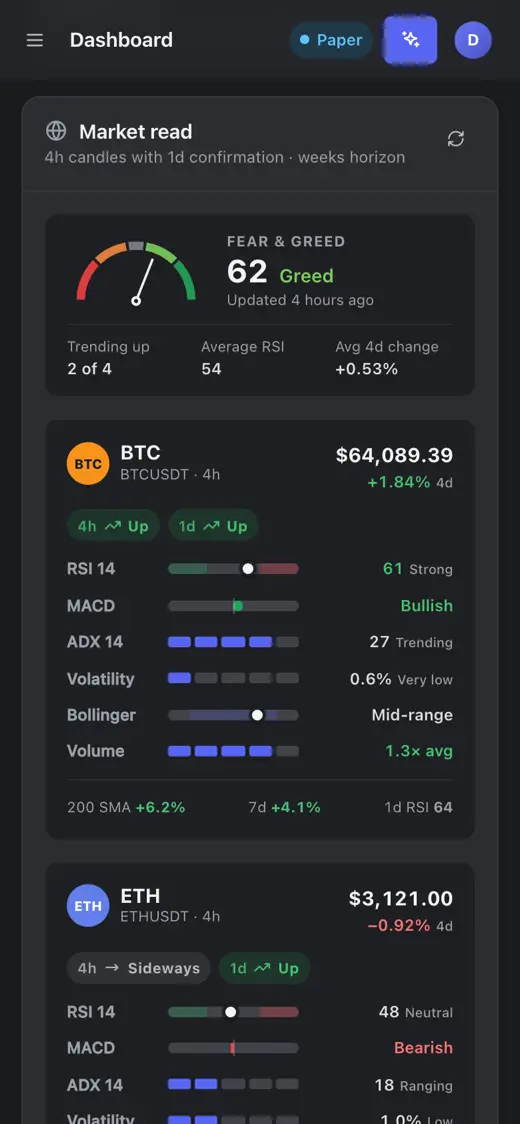
Average gain against average loss over 14 closed candles. The averages start as a simple mean and are then smoothed Wilder’s way (L̄ the same as Ḡ). A perfectly flat market reads 50; readings above 70 are conventionally called overbought, below 30 oversold.
Two exponential averages of the close; the gap between them is momentum. The signal line smooths that gap, and the histogram shows whether momentum is building or fading. Each EMA starts from the simple average of its first n values.
A 20-candle average with a band two standard deviations either side. %B places the latest close inside the band — 0 at the lower edge, 1 at the upper, above 1 outside it — and bandwidth says how wide, that is how volatile, the market currently is.
Volatility
ATR — Average True Range
n = 14Wilder smoothing
The typical size of one candle, gaps from the previous close c included. It starts as the mean of the first 14 true ranges and is then smoothed. ForecastPro reports it as a percentage of the price P, so a $60,000 coin and a $0.10 coin compare directly.
Trend strength
ADX with +DI and −DI
n = 14Wilder smoothing
+DI and −DI (DI⁺, DI⁻) say which side has been pushing — DM⁻ mirrors DM⁺ with d and u swapped, and S is Wilder’s running sum. ADX says how strongly a trend is running, whichever its direction. The DIs need 15 candles and ADX needs 28, because its first value averages 14 DX readings.
Each coin gets this label on its trading timeframe and on the next one up (1h with 4h, 4h with 1d, 1d with 1w), so a short-term signal is read against the bigger trend. Before 200 candles exist, price against SMA 50 must agree with EMA 12 against EMA 26. The label is context for Claude, not a gate rule.
Risk gate
Position sizing: two caps, one min
budget Bcap share p
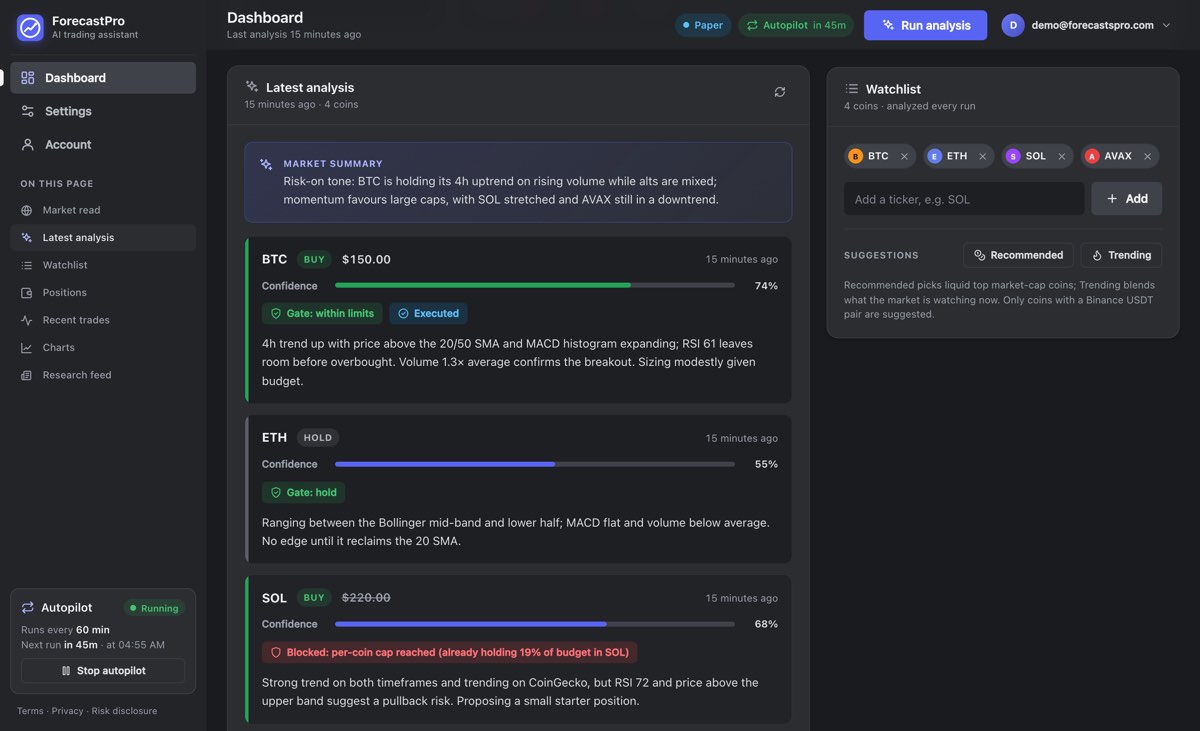
Claude proposes a size; the gate clamps it to whichever cap binds first — the per-coin cap or the total budget cap — and names it. Both caps count only what the bot bought, each position at the larger of what it cost and what it is worth, so neither a rally nor a drawdown makes them look roomier than they are. Buys approved earlier in the same cycle count too.
Risk gate
Daily-loss kill switch
rolling 24 hper venue
Realized profit and loss over the last 24 hours, average-cost basis, protective stop-loss and take-profit fills included. Past the limit, new buys pause until the losses roll out of the window. It blocks buys, never exits: sells and protective orders always go through, because they only reduce risk. A sell with no recorded cost basis counts as zero, never as profit.
Positions and profit and loss are replayed from your journal’s filled orders, one book per venue and exchange account, so paper results never mix with real ones. Quantities are what really filled, net of commission; proceeds are net of the fee. Coins you already held are never part of it.
A take-profit limit above and a stop below, from your own levels or the risk profile’s (s, τ in the table below); a level the market has already passed is moved just past the current price P. The stop sells at market where the pair supports it, otherwise as a stop-limit 0.5% under its trigger. A stop does not guarantee the exit price.